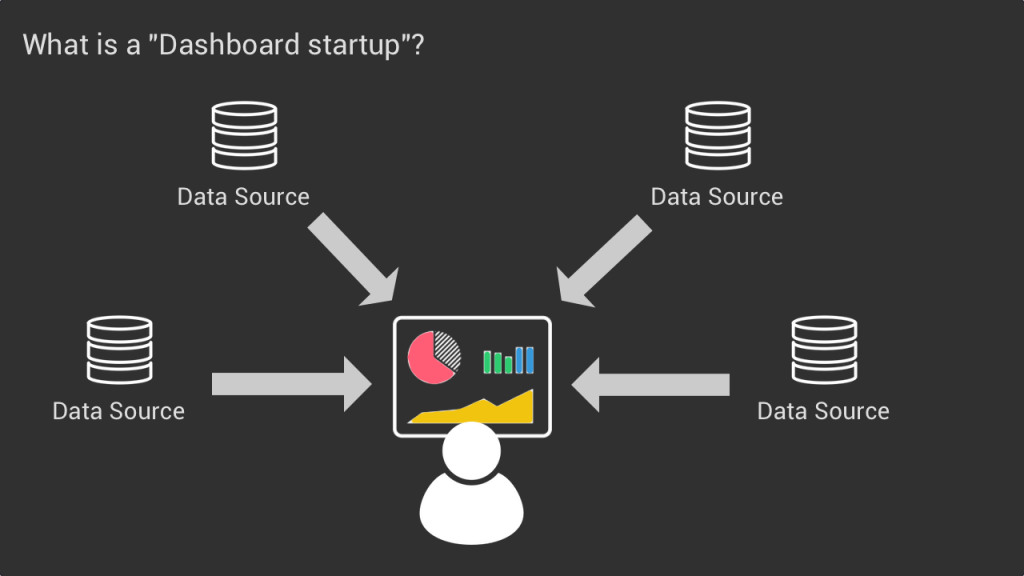
I recently had a discussion with a fellow investor about what I call “dashboard startups”. These are products that enable users to aggregate data from various sources to then visualize it on a dashboard.
We had this discussion because we were both looking at such a company and both of us have maybe the wrong perception that “dashboard startups” can be great businesses but are super hard to scale. And hence how we should look at it from a VC perspective.
However I’m very aware that I could be completely missing the point here, so in this video I will share with you the thinking process behind my conclusion, and hopefully you can challenge it and show me where I’m wrong or the aspects that I missed.
What are dashboard startups?
First of all, by “Dashboard startups” I specifically speak about the products that let you aggregate data and visualize it on a dashboard in order to help you make better decisions. This type of product is very common in the finance and business intelligence categories and chances are high that you know for instance Tableau Software, a BI tool for analysts which was acquired by Salesforce for $15B.
However this model is now spreading in more and more categories:
- Like Okay in the HR category which is a dashboard that enables engineering leaders to monitor the performance of their tech team.
- Or in the product category, with June which provides a dashboard for all your product events metrics.
- This specialization can also happen in specific industries rather than software categories, like chartmogul which focuses on subscription based businesses.
And the list can go on and on for customer success, analytics, sales and marketing etc. etc.
Challenges of dashboard startups
Again my point is no to say that these are bad businesses. Dashboard startups are clearly solving real pain points for their users and can be fantastic businesses. No, my question is strictly related to how you assess them from a VC standpoint and the challenges that they need to overcome in order to scale.
And I see three of them.
Challenges #1: “Solo user” type of products
Many SaaS businesses can scale because their pricing increases based on the number of employees who use the product. This “seat based” pricing is what enables many SaaS products to do revenue expansion or to price their SMB and enterprise customers differently.
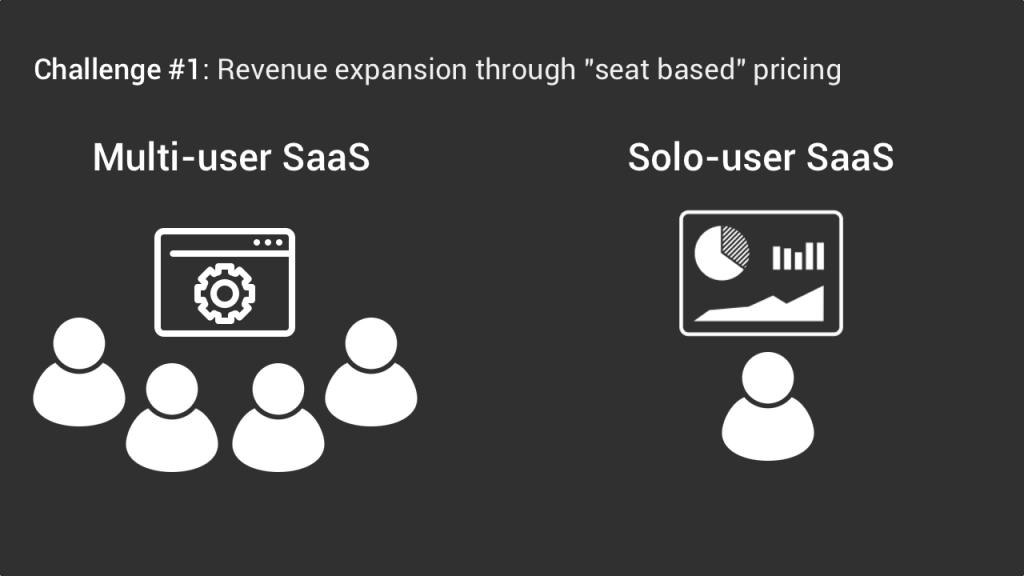
However many dashboard startups do not benefit from these dynamics. Often their product is used by a “solo user”, like a manager or an analyst. The collaboration component for dashboard products is not obvious, and however happy the manager or the analyst is, it can be hard to convert other employees into paying customers. And hence scaling revenue through revenue expansion can be challenging.
As an illustration of this aspect, you cannot find a “seat based pricing” on the pages of Okay, June and Chartmogul.
Challenge #2: “Usage based pricing”
Another dimension through which you can scale revenue is through usage based pricing. For example, the more you use cloud resources on AWS the more expansive your bill. Which seems fair, the more you use something, the more it’s expensive.
It’s in that dimension that most dashboard startups will structure their pricing. As we saw previously, many do not have a seat based pricing, but they do have a usage based pricing.
For example Okay will increase its pricing based on the size of your engineering team. On June it is based on the volume of product actions you track monthly, and on Chartmogul it is based on your current MRR.
The challenge here is that for some dashboard startups it can be harder to justify a price increase when you do not consume more resources for it. It’s probably easier to justify a price increase when you track more events on June than purely based on your MRR like on Chartmogul.
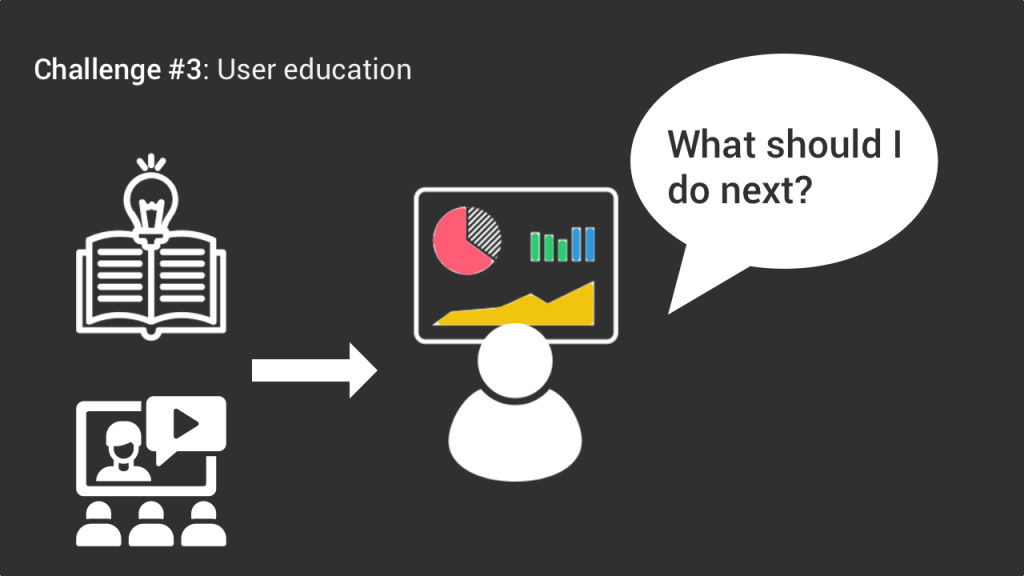
Challenge #3: “Education intensive” products
The last challenge I want to touch upon is about user education. Dashboards and metrics are useful only if they lead to action. And often action is not straightforward. The user needs to interpret the data she sees and apply it to her particular case. And this can require a lot of user education, which is always difficult to do at scale. Not only do you need to provide really great educational content to your users, but you also need to make sure that you successfully educate users for every new customer you acquire.
A good illustration of that is Tableau. They have put in place an amazing education program with a lot of online material but also through a super structured user adoption strategy based on detecting the internal champions of their product, conducting internal workshops to train employees etc. etc. It is truly core to their success, and it’s not something that is easy to do at scale.
Case study: Tableau
If my main question is about scaling it’s because when I checked the Bessemer Cloud Index covering the one hundred most valuable public SaaS companies, I found less than 5 “Dashboard type of companies” in the top 100 and none in the top 50. The most famous one might be amplitude and they rank at the 80th position. Clearly it’s not the dominating product model here.
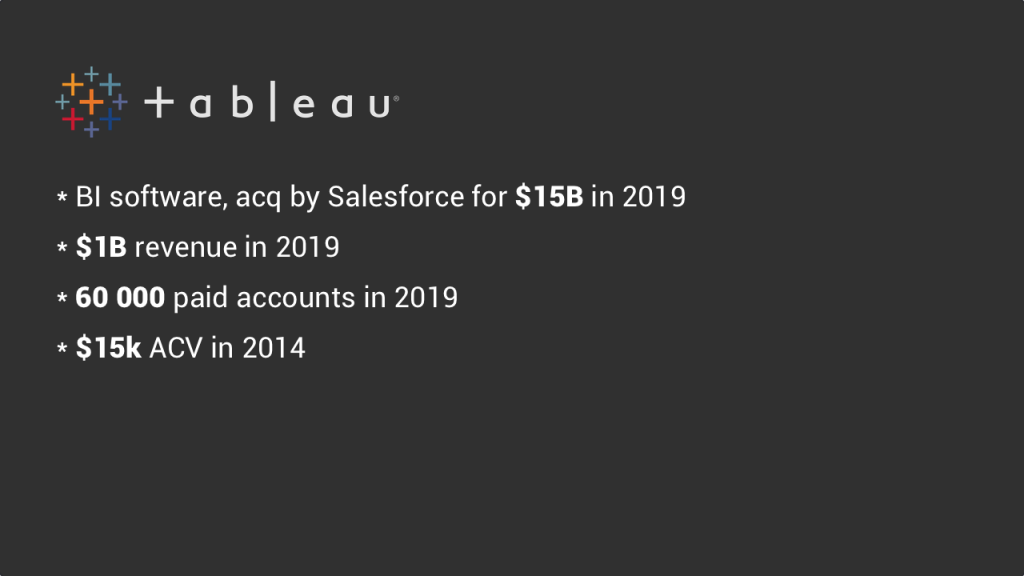
The biggest success that I can think of is Tableau. Tableau is a BI tool that was acquired by Salesforce for 15B dollars back in 2019. Just to give some perspective on the size of the business, at the time of the acquisition Tableau had just passed the 1B revenue mark, with more than 800million in recurring revenue. They had more than 60 000 customer accounts and at the time of their IPO, a couple years before that, their ACV was around 15k dollars per business customer.
Now clearly we can say that it’s a success and if we go back to the three challenges I mentioned earlier I think that tableau was particularly good at solving them.
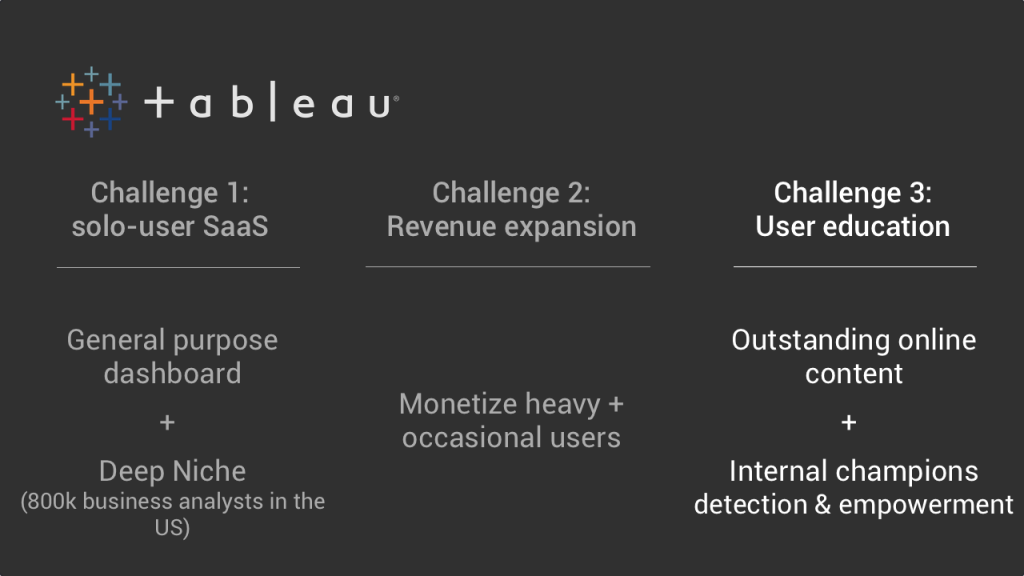
First, they have built a general purpose BI tool that can be used by a wide variety of business analysts. And it’s not a tiny niche, in the US alone there are an estimated 800k business analysts. So while it might not be easy to convert an entire company to using Tableau, like Slack for example, they do have a huge number of potential users for their product.
Second, they structured their pricing around different types of users: creator, explorer and viewer ranging from 70 to 15 dollars per month per account. So they found a way to monetize users who are occasional Tableau users and just need to see data, and not necessarily to manipulate it.
Third, they managed to put in place a successful user education strategy with a huge amount of educational content available online, from online classes to webinars and career paths, complemented by very structured actions within their business customers with programs specifically targeted at internal champions who are incentivized to train their colleagues.
Conclusion
In conclusion, Tableau showed that it’s possible to scale such businesses, but as we could see with the Cloud index of the 100 most valuable companies, only a few managed to do it, and I believed that it requires certain characteristics to do so.
But I’m also aware that the situation might change and potentially more and more of dashboard startups will scale to the hundreds of millions of dollars of revenue because the market is getting deeper and because data literacy is improving with an increasing number of employees using metrics dashboard and not just analysts. This is why I’m more than happy to hear your thoughts about it and see the elements I might have overlooked.